Monday, March 30, 2026 · SAP Center at San Jose

St. Louis Blues
Away
4–5
Final
San Jose Sharks
Home
Social Box Score
St. Louis Blues
0 categories won
San Jose Sharks
8 categories won
Platform Breakdown — Output
STL
SJS
Platform Breakdown — Views
STL
SJS
Top Content
STL


SJS
Mis got mic’d for photo day. 🎙️ #nhl #sharks #hockey
890.6K views
Wins at home always hit different. 🗣️ #nhl #sharks #hockey
320.1K views

Mic'd Up: Misa at Team Photo Day #hockey #nhl #sharks
205.1K views
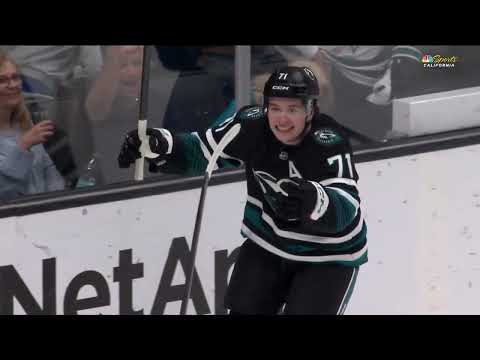
💯 for Mack. #nhl #sharks #macklincelebrini
177.5K views
Knew something was missing. 🦷😆 #nhl #sharks #hockey
170.0K views
Posting Timeline
Peak Posting Window
STL posts heaviest during Pre-Game (Day of)
SJS posts heaviest during Pre-Game (2 hrs)
All Videos (18)
St. Louis Blues (3 videos)

San Jose Sharks (15 videos)
 2:45
2:45Making Waves: Pride Scrimmage
Mar 30
 1:26
1:26Mic'd Up: Misa at Team Photo Day
Mar 30
1:26Mic'd Up: Misa at Team Photo Day #hockey #nhl #sharks
Mar 30
 2:39
2:39Sharks Access: Team Photo Day
Mar 30
 4:03
4:03Postgame vs STL (3/30): Celebrini
Mar 31
 1:01
1:01Welcome to the 100 Club, Macklin Celebrini. #hockey #nhl #sharks #macklincelebrini
Mar 31
 2:00
2:00San Jose Sharks Highlights vs St Louis Blues (3/30)
Mar 31
 0:12SHORT
Gaudette wins it with 21 seconds left! #hockey #nhl #sharks
Mar 31
 6:44
6:44Postgame vs STL (3/30): Warsofsky
Mar 31
 0:10SHORT
Mack hits the 💯 point mark! #hockey #nhl #sharks #macklincelebrini
Mar 31
 3:57
3:57Postgame vs STL (3/30): Gaudette
Mar 31
 7:26
7:26Brodie’s Breakdown vs STL (3/30)
Mar 31
 1:00SHORT
Macklin Celebirni hits 100
Mar 31
 0:56SHORT
Thanks for the caption inspo guys. 😂 #hockey #nhl #sharks
Apr 1
 18:44
18:44State of the Sharks: Joe Will
Apr 1
Head-to-Head History (12)
Mar 26
2025-26
1 - 2
Dec 12
2024-25
4 - 3
Nov 21
2024-25
2 - 3
Oct 10
2024-25
5 - 4
Apr 6
2023-24
2 - 3
Nov 16
2023-24
1 - 5
Mar 9
2022-23
2 - 4
Mar 2
2022-23
6 - 3
Nov 10
2022-23
3 - 5
Apr 21
2021-22
3 - 1
Nov 18
2021-22
1 - 4
Nov 4
2021-22
5 - 3