Thursday, March 26, 2026 · Enterprise Center
San Jose Sharks
Away
1–2
Final

St. Louis Blues
Home
Social Box Score
San Jose Sharks
8 categories won
St. Louis Blues
0 categories won
Platform Breakdown — Output
SJS
STL
Platform Breakdown — Views
SJS
STL
Top Content
SJS
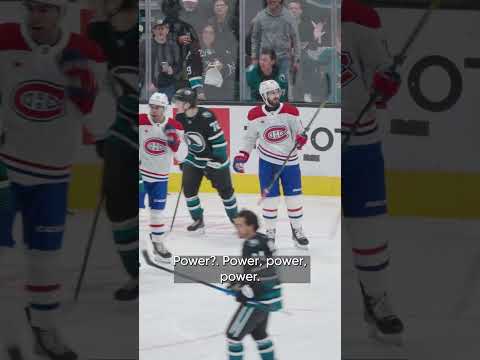
🗣️ "YOU DON'T WANT THAT." - William Eklund #hockey #nhl #sharks
536.5K views
🗣️ "YOU DON'T WANT THAT." - William Eklund #hockey #nhl #sharks
536.5K views
For sure Dickie’s fault here. 😂 #nhl #sharks #hockey
88.7K views
Top shelf. 🎯 #nhl #sharks #hockey
35.8K views

🗣️ LET'S GO. #hockey #nhl #sharks
19.4K views

Posting Timeline
Peak Posting Window
SJS posts heaviest during During Game
STL posts heaviest during During Game
All Videos (12)
San Jose Sharks (9 videos)
 5:47
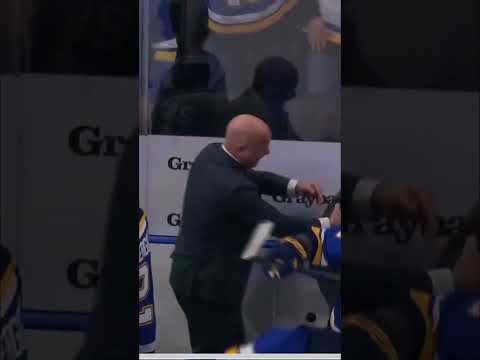
5:47Brodie’s Breakdown at STL (3/26)
Mar 27
 1:01
1:01Alexander Wennberg nominated for King Clancy Trophy
Mar 27
 4:18
4:18Postgame at STL (3/26): Warsofsky
Mar 27
 0:13SHORT
Eky called that one.🚨 #hockey #nhl #sharks
Mar 27
0:14SHORT🗣️ "YOU DON'T WANT THAT." - William Eklund #hockey #nhl #sharks
Mar 27
 2:32
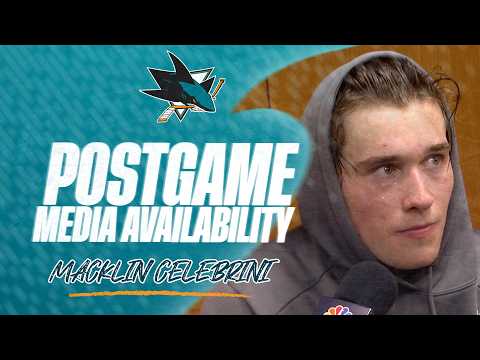
2:32Postgame at STL (3/26): Celebrini
Mar 27
 2:40
2:40Postgame at STL (3/26): Wennberg
Mar 27
0:17SHORT🗣️ LET'S GO. #hockey #nhl #sharks
Mar 27
 0:10SHORT
Alex Wennberg goes top shelf. 🎯 #hockey #nhl #sharks
Mar 27

Head-to-Head History (12)
Mar 30
2025-26
4 - 5
Dec 12
2024-25
4 - 3
Nov 21
2024-25
2 - 3
Oct 10
2024-25
5 - 4
Apr 6
2023-24
2 - 3
Nov 16
2023-24
1 - 5
Mar 9
2022-23
2 - 4
Mar 2
2022-23
6 - 3
Nov 10
2022-23
3 - 5
Apr 21
2021-22
3 - 1
Nov 18
2021-22
1 - 4
Nov 4
2021-22
5 - 3