Sunday, April 5, 2026 · Xfinity Mobile Arena

Boston Bruins
Away
1–2
Final

Philadelphia Flyers
Home
Social Box Score
Boston Bruins
1 categories won
Philadelphia Flyers
7 categories won
Platform Breakdown — Output
BOS
PHI
Platform Breakdown — Views
BOS
PHI
Top Content
BOS
Posting Timeline
Peak Posting Window
BOS posts heaviest during Pre-Game (Day of)
PHI posts heaviest during Post-Game (2-3 hr)
All Videos (27)
Boston Bruins (9 videos)
 4:30
4:30Jordan Harris, Jeremy Swayman, and Casey Mittelstadt talk after 3-1 L @ TBL
Apr 5
 0:25SHORT
800 games for Zaddy!
Apr 5
 0:14SHORT
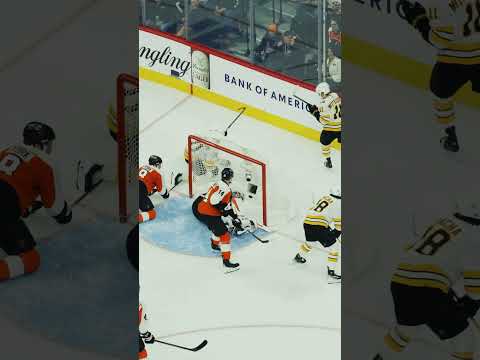
A POWER PLAY GOAL FROM PAV!!
Apr 5
 0:18SHORT
When in Philadelphia 💪
Apr 5
 0:08SHORT
WHAT A GLOVE SAVE FROM KORPI!
Apr 5
 6:10
6:10Zacha, Geekie, and Pastrnak speak with the media following 2-1 OTL at PHI
Apr 5
 3:01
3:01Sturm speaks with the media following 2-1 OTL at PHI
Apr 5
 4:25
4:25Sturm speaks with the media ahead of matchup at PHI
Apr 5
 1:42
1:42Marco Sturm talks after the B's fall 3-1 @ TBL
Apr 5
Philadelphia Flyers (18 videos)
 2:01
2:014/5 PA Lottery Pregame Preview: PHI vs. BOS
Apr 5
 6:44
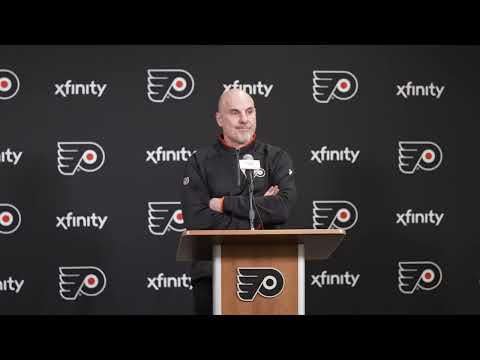
6:444/5 PHI vs. BOS Pregame: Rick Tocchet
Apr 5
 1:15
1:154/5 PHI vs. BOS Postgame: Dan Vladar
Apr 6
 6:12
6:124/5 PHI vs. BOS Postgame: Rick Tocchet
Apr 6
 3:14
3:144/6 Media Availability: Sean Couturier
Apr 6
 0:24SHORT
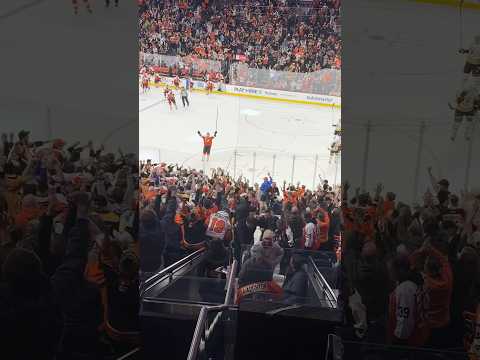
pov: you’re against the glass for the group hug #shorts
Apr 6
 3:00
3:004/5 PHI vs. BOS Postgame: Porter Martone
Apr 6
 1:17
1:174/6 Media Availability: Luke Glendening
Apr 6
 0:41SHORT
Porter Martone named Player of the Game #shorts
Apr 6
 0:15SHORT
"Ziggy got me in a bit of a headlock there." 🤣 #shorts
Apr 6
 2:28
2:284/5 PHI vs. BOS Postgame: Noah Cates
Apr 6
 0:21SHORT
PORTER MARTONE SCORES HIS FIRST NHL GOAL! #shorts
Apr 6
 7:19
7:194/6 Media Availability: Rick Tocchet
Apr 6
 0:18SHORT
That crowd pop. 💥 #shorts
Apr 6
 20:20
20:20Prospect Pipeline: Porter Martone Arrives
Apr 6
 1:14
1:144/5 PHI vs. BOS Postgame: Christian Dvorak
Apr 6
 1:16
1:164/6 Media Availability: Tyson Foerster
Apr 6
 31:14
31:14Flyers Daily with Jason Myrtetus 4-6-2026 Bill Meltzer and the Extraordinary Week That Was
Apr 6
Head-to-Head History (16)
Dec 7
2024-25
3 - 4
Nov 2
2024-25
final
Oct 29
2024-25
final
Oct 1
2024-25
1 - 4
Mar 23
2023-24
2 - 3
Mar 16
2023-24
5 - 6
Jan 27
2023-24
6 - 2
Oct 2
2023-24
1 - 3
Apr 9
2022-23
5 - 3
Jan 16
2022-23
final
Nov 17
2022-23
1 - 4
Oct 1
2022-23
final
Jan 13
2021-22
2 - 3
Nov 20
2021-22
5 - 2
Oct 20
2021-22
3 - 6
Oct 4
2021-22
1 - 2