Saturday, April 11, 2026 · SAP Center at San Jose
Vancouver Canucks
Away
4–3
Final
San Jose Sharks
Home
Social Box Score
Vancouver Canucks
0 categories won
San Jose Sharks
8 categories won
Platform Breakdown — Output
VAN
SJS
Platform Breakdown — Views
VAN
SJS
Top Content
VAN
SJS
Posting Timeline
Peak Posting Window
VAN posts heaviest during Pre-Game (2 hrs)
SJS posts heaviest during Next Day
All Videos (25)
Vancouver Canucks (8 videos)
 0:16SHORT
BIG-TIME BLUEGER.
Apr 12
 3:22
3:22Adam Foote Pre-Game Media | Vancouver Canucks at Anaheim Ducks (Apr 12 2026)
Apr 12
 3:29
3:29Liam Öhgren on Developing His Game & Gaining Confidence in Vancouver | 1-on-1 with Olivia McDonald
Apr 12
 2:42
2:42Marco Rossi & Adam Foote Post-Game Media | Vancouver Canucks at San Jose Sharks (Apr 11 2026)
Apr 12
 10:00
10:00Game in 10 | Vancouver Canucks at San Jose Sharks Highlights (Apr 11 2026)
Apr 12
 1:01
1:01Linus Karlsson 1-on-1 After Shootout Winner | Canucks at Sharks (Apr 11 2026)
Apr 12
 0:20SHORT
🧸 + 🪓
Apr 12
 0:23SHORT
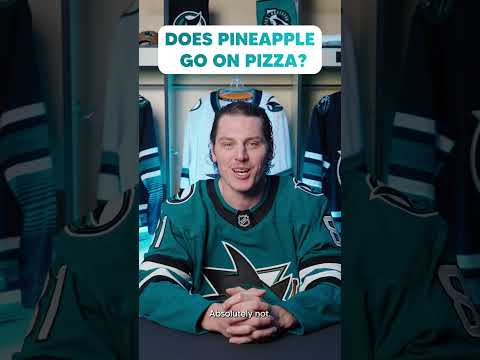
Round 6 winner from our guy Linus 😌
Apr 12
San Jose Sharks (17 videos)
 0:10SHORT
CHERNYSHOV OPENS UP THE SCORING! 🚨#hockey #nhl #sharks
Apr 12
 6:01
6:01Brodie’s Breakdown vs VAN (4/11)
Apr 12
 5:52
5:52Postgame vs VAN (4/11): Coach Warsofsky
Apr 12
 3:08
3:08Postgame vs VAN (4/11): Celebrini
Apr 12
 4:00
4:00Postgame vs VAN (4/11): Chernyshov
Apr 12
 2:16
2:16Postgame vs VAN (4/11): Askarov
Apr 12
 0:15SHORT
THAT'S ✌️FOR CHERNY! #hockey #nhl #sharks
Apr 12
 0:15SHORT
GOAL TWO BY TOFF! 🔥 #hockey #nhl #sharks
Apr 12
 7:59
7:59Sharks Mic Check: Trailer Park Sports Network
Apr 13
 1:11
1:11Sharks Rapid Fire Part 3 #hockey #nhl #sharks
Apr 13
 1:06
1:06A little splash of color brings everything together. #hockey #nhl #sharks
Apr 14
 0:08SHORT
CELEBRINI SCORES! 🚀 #hockey #nhl #sharks
Apr 14
 0:09SHORT
CHERNYSHOV OPENS UP THE SCORING! 🚨 #hockey #nhl #sharks
Apr 14
 1:32
1:32Postgame at NSH (4/13): Coach Warsofsky
Apr 14
 1:25
1:25Postgame at NSH (4/13): Nedeljkovic
Apr 14
 5:57
5:57Brodie’s Breakdown vs NSH (4/13)
Apr 14
 0:23SHORT
Sharks win at Nashville #hockey #nhl #sharks
Apr 14
Head-to-Head History (16)
Apr 14
2024-25
1 - 2
Feb 6
2024-25
2 - 1
Dec 23
2024-25
3 - 4
Nov 2
2024-25
3 - 2
Dec 23
2023-24
4 - 7
Nov 25
2023-24
3 - 4
Nov 20
2023-24
1 - 3
Nov 2
2023-24
10 - 1
Mar 23
2022-23
2 - 7
Dec 27
2022-23
2 - 6
Dec 7
2022-23
6 - 5
Nov 27
2022-23
4 - 3
Apr 9
2021-22
2 - 4
Feb 17
2021-22
5 - 4
Dec 21
2021-22
postponed
Dec 16
2021-22
5 - 2