Saturday, March 21, 2026 · American Airlines Center

Los Angeles Clippers
Away
138–131
Final

Dallas Mavericks
Home
Social Box Score
Los Angeles Clippers
2 categories won
Dallas Mavericks
6 categories won
Platform Breakdown — Output
LAC
DAL
Platform Breakdown — Views
LAC
DAL
Top Content
LAC
DAL
The Ankletaker ranks himself amongst elite ball handlers 🖐️ #dallasmavericks #kyrieirving #nba
4.8M views
Celebrating Kai all day 🎉 #dallasmavericks #NBA #kyrieirving
505.8K views
It’s just what he does 🤷 #dallasmavericks #NBA #klaythompson
162.0K views
We’re doing a trend. How you doing? 👋 #firstperson #dallasmavericks #NBA
78.4K views
Oh, we are framin’ that!! 🖼️ #dallasmavericks #NBA #poster
37.0K views
Posting Timeline
Peak Posting Window
LAC posts heaviest during Post-Game (3+ hr)
DAL posts heaviest during Next Day
All Videos (27)
Los Angeles Clippers (14 videos)
 0:17SHORT
OMG DJJ Nasty Putback 🤯
Mar 22
 4:59
4:59Clippers Take Over in OT Thriller vs Mavericks
Mar 22
 0:40SHORT
DJJ Huge Buckets Down the Wire ⏰
Mar 22
 2:54
2:54Darius Garland GOES OFF for 41 PTS (8 3PM) vs Mavs 🔥
Mar 22
 0:08SHORT
Garland Reacts After Dropping 41 🗣️
Mar 22
 0:22SHORT
WHAT A DIME from Jordan Miller 👀
Mar 22
 2:00
2:00Garland goes CRAZY for 41 🤯
Mar 22
 0:24SHORT
Kawhi Leonard Is COLD 🥶
Mar 22
 1:55
1:55Kawhi CLUTCH 34 PTS vs Mavs 🤖
Mar 22
 0:59SHORT
Kawhinator terminates the Mavs 🤖
Mar 22
 0:16SHORT
Kawhi Clutch 3 off 1 Leg 😬
Mar 23
 3:32
3:32Kawhi Leonard Drops 34 in CLUTCH OT Win vs Mavs
Mar 23
 1:37
1:37Garland Hits 8 THREES 🔥
Mar 23
 0:18SHORT
Brook Lopez Career 18,000 Points 🎉
Mar 23
Dallas Mavericks (13 videos)
 22:05
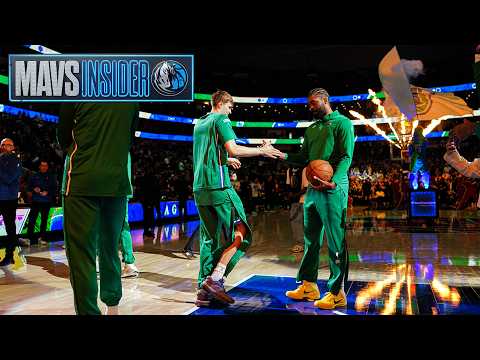
22:05MavsTV | Mavs Insider | March 20, 2026
Mar 21
 2:00
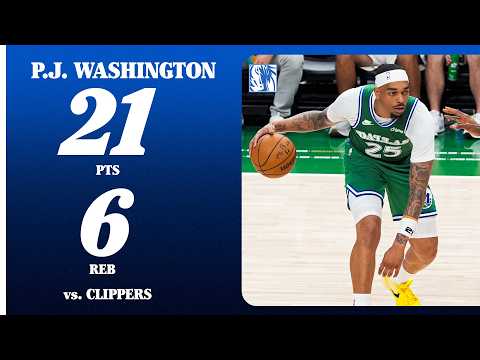
2:00P.J. Washington (21 PTS 6 REB) vs. Los Angeles Clippers | March 21, 2026
Mar 22
 1:32
1:32Top 5 Plays of the Week! 3/15/26 - 3/21/26
Mar 22
 2:13
2:13Mavericks Highlights vs. Los Angeles Clippers | March 21, 2026
Mar 22
 2:10
2:10Cooper Flagg (18 PTS 10 REB 8 AST) vs. Los Angeles Clippers | March 21, 2026
Mar 22
 2:08
2:08Naji Marshall (28 Points) vs. Los Angeles Clippers | March 21, 2026
Mar 22
 19:39
19:39Jason Kidd, Cooper Flagg, & Marvin Bagley III | Post-Game Media Availability vs LAC | 3/21/26
Mar 22
 0:20SHORT
Oh, we are framin’ that!! 🖼️ #dallasmavericks #nba #poster
Mar 23
 0:12SHORT
Dude you’re KYRIE IRVING 🤩 #kyrieirving #dallasmavericks #nba
Mar 23
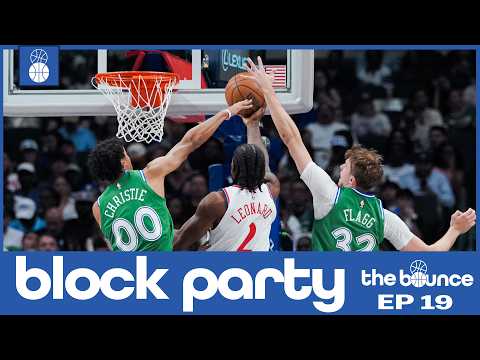 22:01
22:01Block Party | The Bounce | EP 19 | 3/23/2026
Mar 23
 0:07SHORT
That’s a grown man JAM 😤 #dallasmavericks #nba #poster
Mar 23
 0:58SHORT
It’s just what he does 🤷 #dallasmavericks #nba #klaythompson
Mar 23
 0:09SHORT
The boys clean up nice 🤩 #dallasmavericks #nba #basketball
Mar 23
Head-to-Head History (25)
Apr 7
2025-26
103 - 116
Nov 14
2025-26
133 - 127
Apr 5
2024-25
104 - 135
Apr 4
2024-25
91 - 114
Dec 21
2024-25
97 - 113
Dec 19
2024-25
118 - 95
Oct 14
2024-25
96 - 110
May 3
2023-24
101 - 114
May 1
2023-24
123 - 93
Apr 28
2023-24
116 - 111
Apr 26
2023-24
90 - 101
Apr 23
2023-24
96 - 93
Apr 21
2023-24
97 - 109
Dec 20
2023-24
120 - 111
Nov 25
2023-24
88 - 107
Nov 10
2023-24
126 - 144
Feb 8
2022-23
110 - 104
Jan 22
2022-23
112 - 98
Jan 10
2022-23
101 - 113
Nov 15
2022-23
101 - 103
Feb 12
2021-22
99 - 97
Feb 10
2021-22
105 - 112
Nov 23
2021-22
112 - 104
Nov 21
2021-22
91 - 97
Oct 8
2021-22
114 - 122