Wednesday, May 13, 2026 · Inter&Co Stadium
Philadelphia Union
Away
3–4
Final
Orlando City SC
Home
Social Box Score
Philadelphia Union
7 categories won
Orlando City SC
1 categories won
Platform Breakdown — Output
PHI
ORL
Platform Breakdown — Views
PHI
ORL
Top Content
PHI
@cavan.sull scores his first @Major League Soccer goal 🙌 #mls #cavansullivan #homegrown #fyp
173.0K views
Stop signs aren’t optional, @cavan.sull 🤣 #DOOP | @americastire
170.4K views
@cavan.sull’s first @mls goal 🙌
167.6K views
Well-earned first @Major League Soccer al for @cavan.sull 👏
74.1K views
Ben Bender snags his first goal for the U in @mls play and @stas.korzeniowski grabs his first assist in league-play!
56.3K views
Posting Timeline
Peak Posting Window
PHI posts heaviest during During Game
ORL posts heaviest during During Game
All Videos (9)
 0:58SHORT
Cavan Sullivan goes Mic'd Up for Union Training
May 12
 10:03
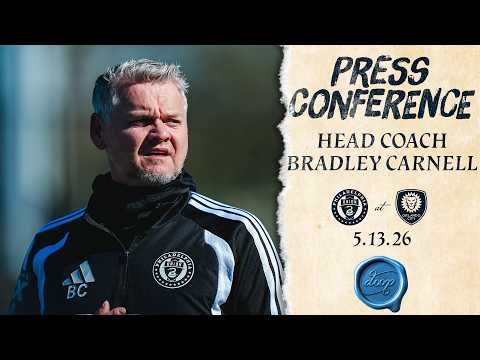
10:03Press Conference | Bradley Carnell ahead of the Union's road match at Orlando City SC.
May 12
 1:19
1:19The best sports city in the world is about to take the world stage this summer ⚽️
May 13
 29:55
29:55Alan O'Mara: Resilience Under Pressure | HEADFIRST presents: The Pressure Lab
May 13
 0:22SHORT
Ben Bender ties the game for #doop with his first Union goal ⚽️
May 14
 11:02
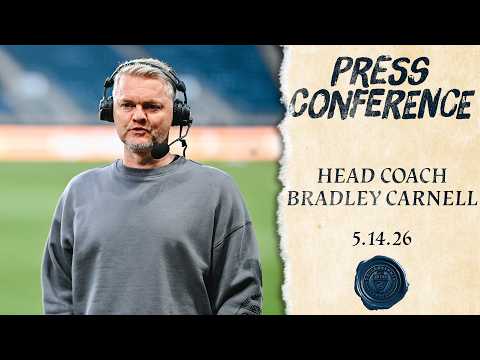
11:02Press Conference | Bradley Carnell after the Union's match at Orlando City SC
May 14
 10:45
10:45Press Conference | Bradley Carnell ahead of the Union's home contest against the Columbus Crew
May 14
 0:25SHORT
Cavan Sullivan nets his first MLS Goal ⚽️ 🔥
May 14
 10:32
10:32Match Highlights: Philadelphia Union at Orlando City SC 5/13/26
May 14