Saturday, March 21, 2026 · Bridgestone Arena
Vegas Golden Knights
Away
1–4
Final
Nashville Predators
Home
Social Box Score
Vegas Golden Knights
6 categories won
Nashville Predators
2 categories won
Platform Breakdown — Output
VGK
NSH
Platform Breakdown — Views
VGK
NSH
Top Content
VGK
Posting Timeline
Peak Posting Window
VGK posts heaviest during Pre-Game (Day of)
NSH posts heaviest during Pre-Game (Day of)
All Videos (14)
Vegas Golden Knights (6 videos)
 19:58
19:58AFC Bournemouth Legend Steve Fletcher Sits Down with Daren Millard
Mar 20
 13:19
13:19🎥 POSTGAME SOUND: Hanifin, McNabb & Cassidy
Mar 20
 11:05
11:05HIGHLIGHTS | Nashville Predators 4, Vegas Golden Knights 1 | March 21, 2026
Mar 21
 5:03
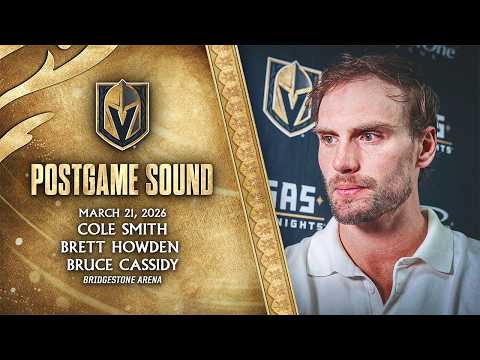
5:03🎥 POSTGAME SOUND: Smith, Howden & Cassidy
Mar 21
 22:01
22:01Knight Life | Episode 25
Mar 21
 0:55SHORT
“Are we going? Alright, let’s go.”
Mar 21
Nashville Predators (8 videos)
 10:57
10:57Stamkos, O’Reilly, Jost & Brunette - Postgame: March. 21, 2026
Mar 21
 0:39SHORT
FACTOR PPG FOR A 4-1 LEAD #predsnhl
Mar 21
 0:27SHORT
JOSTY SHORTY #predsnhl
Mar 21
 0:36SHORT
STEVEN STAMKOS SCORES HIS 238TH PPG 🤯 #predsnhl
Mar 21
 1:45
1:45Tyson Jost Postgame Interview: March 21st
Mar 21
 5:49
5:49Meet Jerry Neal: The 104-Year-Old Veteran Pilot Whose Plane Went Down on D-Day - Nashville Predators
Mar 21
 1:14
1:14Steven Stamkos First Star Interview: March 21st
Mar 21
 0:24SHORT
Stammer + Factor team up for the 🚨 #predsnhl
Mar 21
Head-to-Head History (10)
Apr 12
2024-25
3 - 5
Jan 14
2024-25
3 - 5
Mar 26
2023-24
4 - 5
Feb 20
2023-24
5 - 3
Jan 15
2023-24
1 - 4
Apr 4
2022-23
2 - 3
Feb 7
2022-23
5 - 1
Mar 24
2021-22
1 - 6
Jan 4
2021-22
3 - 2
Nov 24
2021-22
5 - 2