Sunday, March 29, 2026 · Benchmark International Arena

Nashville Predators
Away
2–3
Final

Tampa Bay Lightning
Home
Social Box Score
Nashville Predators
5 categories won
Tampa Bay Lightning
3 categories won
Platform Breakdown — Output
NSH
TBL
Platform Breakdown — Views
NSH
TBL
Top Content
NSH
TBL
Period 🤏 #nhl #tampa #hockey #family #lightning
64.4K views
Supplied the guys with lucky ties 👔 #kids #nhl #dads #lucky #custom
63.0K views
Lucas James meets his Gift of Life donor, @NLL player Patrick Shoemay 💙 #nhl #giftoflife #hockey #tampa
29.2K views
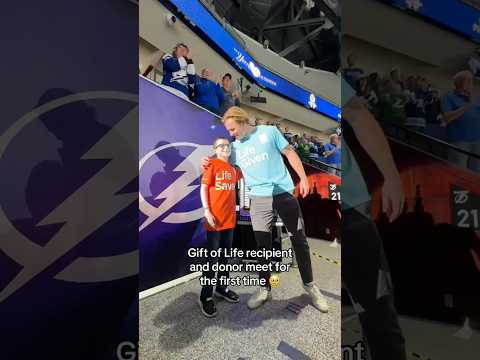
Lucas James meets his Gift of Life donor, NLL player Patrick Shoemay 💙 #nhl #tampa #hockey #nll
11.4K views
Lucas James meets his Gift of Life donor, NLL player Patrick Shoemay 💙 #nhl #tampa #hockey #nll
11.4K views
Posting Timeline
Peak Posting Window
NSH posts heaviest during During Game
TBL posts heaviest during Pre-Game (Day of)
All Videos (13)
Nashville Predators (7 videos)
 0:20SHORT
FILthy pinball goal
Mar 29
 0:40SHORT
A first NHL goal for Kemmy that you have to see to believe 🤯
Mar 29
 6:50
6:50Josi, Evangelista & Brunette Postgame: March 28, 2026
Mar 29
 1:15
1:15Ryan O'Reilly Postgame Interview: March 28th
Mar 29
 0:35SHORT
ZLH nets one 🚨 #predsnhl
Mar 29
 1:24
1:24Zach L'Heureux: Postgame Interview - March 29th
Mar 30
 45:44
45:44Stopping Pucks During a Postseason Push feat. Justus Annunen - Preds Official Podcast
Apr 1
Tampa Bay Lightning (6 videos)
 1:27
1:27Rewinding it back to yesterday ⏮️
Mar 29
 10:52
10:52Postgame Media vs TBL | Lilleberg, Hagel, Cooper
Mar 29
 0:56SHORT
Supplied the guys with lucky ties 👔
Mar 30
 1:24
1:24How we spent our Sunday ⤴️
Mar 30
 11:48
11:48Postgame Media vs NSH | Johansson, Perry, Guentzel, Cooper
Mar 30
0:22SHORTLucas James meets his Gift of Life donor, NLL player Patrick Shoemay 💙 #nhl #tampa #hockey #nll
Mar 30
Head-to-Head History (9)
Oct 28
2024-25
2 - 3
Oct 7
2024-25
cancelled
Dec 7
2023-24
1 - 5
Oct 10
2023-24
3 - 5
Dec 8
2022-23
2 - 5
Nov 19
2022-23
3 - 2
Apr 23
2021-22
2 - 6
Feb 26
2021-22
3 - 2
Oct 2
2021-22
1 - 6